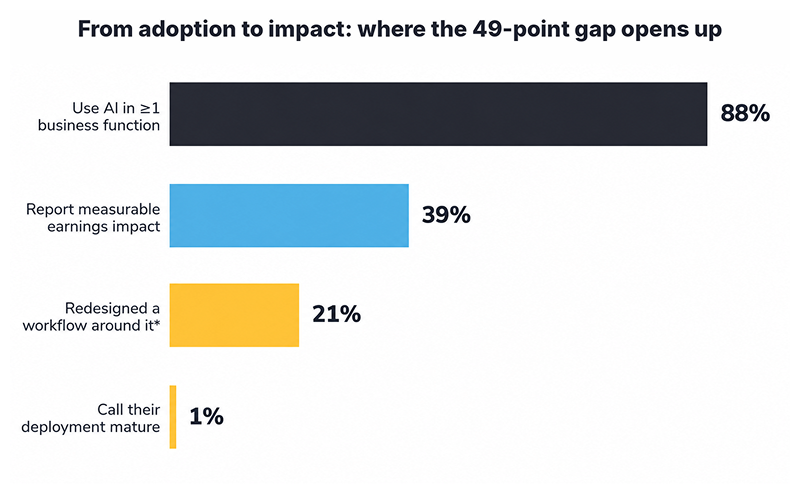
*88% of organizations use AI in at least one business function; 39% report a measurable earnings impact; 21% (separate report, 78% baseline) have redesigned a workflow around it; 1% call their deployment mature. Source: Axis Intelligence compilation of McKinsey State of AI 2025 / AI Trust Maturity, March 2026.
One more figure worth flagging up front: the 21% workflow-redesign number above comes from a different report, paired with a different adoption baseline (78%, not 88%). Mixing figures from different survey waves like that is exactly the trap this article is here to help you avoid.
This guide is for CTOs, VPs of Engineering, and digital leaders who need a real answer before budget season: is your AI adoption actually behind your industry, or does it just look that way? It reconciles the 2026 AI adoption numbers sector by sector, with sourcing for every figure, and ends with a four-question framework for benchmarking your own progress; one that doesn't depend on which survey happened to land in your inbox.
In short
- The gap between “adopted AI” and “AI that's actually working” is wide (see the chart above for the full drop-off).
- The adoption rate for your industry depends entirely on which survey you're reading; the same economy gets measured at 18%, 41%, and 78% by three different federal surveys.
- Tech and finance lead. Government, education, and construction lag furthest behind.
- The real benchmark isn't your industry's percentage, it's whether your own AI initiatives have an owner, a metric, and a changed workflow.
Why the same industry gets three different adoption numbers
A single Federal Reserve research note explains most of the confusion in one place. Economist Jeffrey Allen's FEDS Note triangulates three federal surveys measuring the same US economy in the same period, and gets three different answers.
- The Census Bureau's Business Trends and Outlook Survey, which is firm-weighted and asks a representative sample of businesses (including the smallest ones) whether the business itself uses AI, puts adoption at 18%.
- The Real-Time Population Survey, which is individual-weighted and asks workers whether they personally used generative AI for their job, puts it at 41%.
- The Survey of Business Uncertainty, which is employment-weighted and reports the share of the workforce employed at AI-adopting organizations rather than the share of firms, puts it at 78%.
All three numbers are correct, per Axis Intelligence's breakdown of the data, which walks through why: a single large company with ten thousand employees and one AI pilot moves the employment-weighted number far more than it moves the firm-weighted one.
The same pattern explains the headline 88% figure most 2026 coverage repeats. It comes from Stanford HAI's AI Index, sourced from McKinsey's global State of AI survey: roughly 1,993 respondents across 105 countries, self-selected and weighted toward larger organizations and senior executives. It's a legitimate read on how large-company leadership perceives adoption; just a different population than a probability sample of all US businesses.
Self-selection is what drives the gap here, not dishonesty on anyone's part. A survey that recruits respondents through McKinsey's existing enterprise relationships and business networks will systematically over-represent companies large enough to have a formal AI initiative someone can report on in the first place: small businesses without a dedicated tech function rarely see the invitation, let alone respond to it.
A probability sample like the Census Bureau's, by contrast, has to include the plumber with three employees and no IT budget alongside the Fortune 500 firm running a dozen AI pilots.
Neither survey is measuring “false” adoption; they're drawing from different populations, and a self-selected executive sample will almost always read higher than a probability sample of the same economy.
The takeaway: before you cite an adoption percentage, check whether it's counting firms, workers, or employees at AI-using companies. Those are three different questions with three different answers.
Where does your industry actually stand in 2026?
*Reported 2026 AI adoption by industry — Technology/software 63–88%, Healthcare 62–70%, Financial services 50–79%, Professional services/legal 30–92%, Manufacturing 29–77%, Retail 42–53%, Education 34%, Government/public sector 14–18%, Construction ~12%. Full source list in the table and text below.
A few patterns worth calling out:
Tech and finance lead, but for different reasons. Tech tops every ranking (63–88%) because it builds the infrastructure AI runs on, per Axis Intelligence and AI Stack Hub. Financial services sits mid-range (50–79%) but spends roughly $3,200 per employee on AI — 2.6x the cross-industry average, per Axis Intelligence — concentrated in a handful of high-value use cases like fraud detection and underwriting. Manufacturing shows the widest spread of any sector (29–77%), per AI Stack Hub and MedhaCloud (also reporting 48% YoY growth in manufacturing AI spend), for the same firm-vs-employment reason described above.
Professional services shows the sharpest individual-vs-firm gap: 79% of legal professionals personally use AI tools, up from 19% in 2023, per Azumo, citing Clio's Legal Trends Report. But 63% of professional services partnerships have no firm-wide AI strategy, and the average partnership needs 4.7 committee approvals to greenlight a firm-wide tool versus 1.2 in corporate legal, per Thinking Inc.. Government, education, and construction trail furthest behind (12–18%), held back by procurement cycles, budget limits, or field-based work with little digital data to build on, per Axis Intelligence, MedhaCloud, and Alice Labs' global AI adoption index.
Healthcare and retail sit in the middle, but for opposite reasons. Healthcare adoption is reported between 62% and 70%, per zPlatform (McKinsey, genAI exploration) and MedhaCloud, driven mostly by clinical decision support, medical imaging analysis, and administrative automation — but the gap between “exploring” and “deployed in production” runs wider here than almost anywhere else, because the liability exposure attached to a clinical decision makes hospitals move slower from pilot to rollout than the adoption number alone suggests. Retail runs the opposite pattern: reported adoption is lower overall (42–53%, per zPlatform and MedhaCloud), but narrow, well-defined use cases like AI-driven customer support are reported as high as 95% in some datasets, per Axis Intelligence. Thin retail margins make broad, ground-up AI builds hard to justify, but they don't stop a retailer from buying a single well-proven tool for one narrow job.
Why 88% usage is producing only 39% impact
The 49-point gap between adoption and impact isn't evenly distributed. It concentrates at exactly the point where AI stops being a tool decision and becomes a workflow decision — which is why the professional services numbers above are such a clean illustration. Individual usage scales fast because one person can open a chatbot. Workflow redesign doesn't, because it needs a decision from someone with budget authority.
Three sources point at the same underlying barriers, from three different angles: 52% of businesses cite data quality and availability as their primary constraint, per AI Business Weekly; 70.9% of EU enterprises cite a lack of in-house AI expertise, per the same source, citing Eurostat 2025; and 56% of CEOs report zero measurable ROI from AI despite having deployed it, per AI Business Weekly, citing PwC (Jan 2026).
None of these are model-quality problems. They're data-readiness, skills, and change-management problems, which is exactly why buying a better model doesn't close the gap.
Where the gap does close, it's through ownership, not tool access. The Federal Reserve found generative AI saves an average of 5.4% of work hours (about 2.2 hours a week) per Axis Intelligence's sector breakdown. That's a time-savings number, not an earnings-impact number. The two only connect when a specific person is accountable for turning saved hours into a tracked outcome. Without that, saved time tends to get reabsorbed into the same workflow instead of redirected toward anything with a P&L line attached.
Benchmark your progress, not your industry's percentage
“Are we behind our industry?” assumes the industry number you're comparing against measures the same thing your company is trying to do — and the methodology gap above shows that assumption fails more often than it holds. Run your own AI initiatives through these four questions instead:
- Does it have a named owner with budget authority? Without one, it stays a pilot indefinitely, no matter how many people use it.
- Can you name the metric it's supposed to move? Not “efficiency” in the abstract — a number someone already tracks: cost per loan, handle time, defect rate.
- Has the workflow actually changed? A chatbot bolted onto an unchanged process is adoption. A removed manual step or a changed approval path is redesign.
- Is the real barrier the model — or data, skills, or governance? If it's one of the latter three, a better model won't fix it. A different budget allocation might.
Here's what that looks like on an actual initiative. Say a mid-sized lender rolls out an AI tool to help underwriters draft loan memos. Six months in, usage is high, most underwriters open it daily. Run it through the four questions: no single person owns the initiative, it just lives inside the underwriting team; the only tracked metric is “how many people used it this week,” not memo turnaround time or approval accuracy; the underwriting workflow itself hasn't changed, the tool just sits alongside the old process as an optional draft-starter; and when adoption stalls, nobody can say whether the blocker is model quality, messy loan data, or the fact that compliance still has to manually re-review every AI-touched memo. That's a company that would show up in the 88% — and just as easily in the 61% that never converts to impact.
A company at 30% industry-reported adoption with three initiatives that pass all four questions is genuinely ahead of a company at 80% adoption with pilots that pass none of them. The industry number was never measuring that.
How this shows up in AI-enabled delivery
The same usage-outpacing-redesign pattern shows up directly in software delivery, which is where we see it most closely. DORA's 2025 State of AI-Assisted Software Development research found that roughly 80% of engineers saw average productivity gains of about 3%, while the top 20% averaged 55%. As we cover in our guide to AI in SDLC, McKinsey traces that gap to how organizations integrate AI into workflows — not which tools they bought.
We see the same split with clients: adding an AI coding assistant to an existing process is a tool decision. Building the surrounding system (reusable project context, review checkpoints, engineering rules, MCP integration) so AI takes on more of the workflow while specialists stay accountable for the outcome, is the decision that actually moves a metric. As a member of the Claude Partner Network, we've built that distinction into how we structure AI-enabled delivery.
Conclusion
Your industry's adoption percentage was never a single number; it's four or five surveys asking four or five different questions, and the spread gets wider, not narrower, once you break it down by sector. The more useful benchmark is the one above: a named owner, a specific metric, an actually-changed workflow, and a barrier you can name that isn't “the model isn't good enough.” Start there before the next budget conversation.
If you're evaluating what AI-enabled delivery looks like once an initiative has an owner and a metric, talk to our team.